


CMX Location Tracher
Overview of the Detect and Locate Service
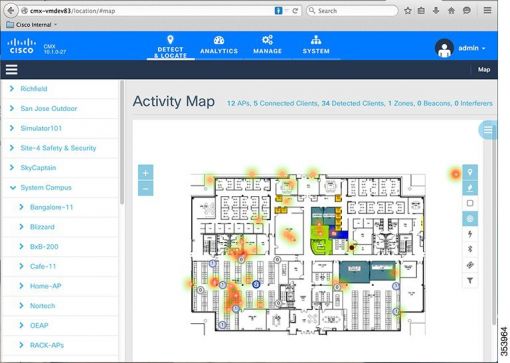
The Cisco Connected Mobile Experiences (Cisco CMX) DETECT & LOCATE service enables you to view and track devices in your deployment.
Using the DETECT & LOCATE service, you can either view all the access points (APs) deployed in all the buildings of a campus or view the APs deployed on the individual floors of each building. You can also locate Wi-Fi tags, rogue APs, Wi-Fi interferers, and Bluetooth low energy (BLE) beacons.
Initial Configurations
In order to use the DETECT & LOCATE service, the following initial configurations have to be performed:
Import maps—For information about this, see Importing Maps and Cisco Wireless Controllers.
Add controllers—For information about concept, see Adding Cisco WLCs.
Viewing or Tracking Devices
Procedure
-
Zones—Click the Zones
 icon to show or hide the zones on a specific floor.
 -
Access Points—Click the Access Points
 icon to show or hide all the APs that have been deployed on a specific floor. APs are displayed as circular objects, with a number in the center. This number indicates the number of clients connected to that specific AP.
Note - Clicking an AP shows the clients connected to it (blue lines), the probing clients that are detected by the AP (red lines), and additional information such as height, orientation, and X,Y location of the AP.
If you have a Cisco Hyperlocation module that is attached to the back of your Cisco Aironet 3700 and 3600 Series APs, you can track the location of customers, visitors, or assets to about one meter in an ideal environment. Currently, the Hyperlocation solution works for the associated clients only.
Interferers—Click the Interferers
 icon to show or hide all the RF interferers that have been detected by the wireless network, and their zone of impact.
Beacons—Click the Beacons
 icon to show or hide BLE-transmitting devices that have been detected by the wireless network. For more information about BLE beacons, see Managing BLE Beacons.
Note A beacon is detected as an interferer. A common problem faced in the context of beacons is tracking not being enabled. In such a scenario, you can modify the tracking configurations using the System service. For more information, see the Viewing or Tracking Devices.
Tags—Click the Tags
 icon to show or hide Wi-Fi tags. The vendor specific information related to the tags are displayed in raw format.
 Filters—Click the Filters
 icon to filter the display of devices based on parameters such as Connection Status, Manufacturer, and Service Set Identifier (SSID).
Inclusion & Exclusion Regions—Click the Inclusion & Exclusion Regions
 icon to view the inclusion and exclusion regions on a floor. The inclusion and exclusion regions are created in Cisco Prime Infrastructure. In Cisco CMX, you can view these regions, but you cannot modify them. The inclusion regions are shown in green, and the exclusion regions are shown in gray.